One whale can make a bad cohort look good.
Cohortful shows you the real picture —
so you know whether to keep spending or stop.

It’s really hard to make the right call about a cohort when it has only a few hundred or a few thousand installs.
A single whale can completely distort the numbers — making a weak cohort look profitable on D0–D7.
You keep spending… and then the whale disappears, and the whole cohort collapses.
So you end up doing one of two things:
You keep pouring money into cohorts that look "okay", hoping they'll get better — and burn thousands of dollars on tests that never pay back.
Or you kill cohorts too early because they look mediocre — and lose campaigns that were actually good.
To turn raw data from AppsFlyer or Adjust into a real answer, you usually need data engineers. Most teams simply don't have them.
That's why we built Cohortful.
No SDK. No complicated integration.
Export from your MMP or BI, add store payouts,
ad revenue, subscriptions — whatever you have.
Or connect via API with just a few lines of code.
We align everything — even with hybrid monetization and multiple sources.
No predictions of the future. We work only with the real data you already have.
Simple, actionable signals for every cohort:
Will it pay back or not?
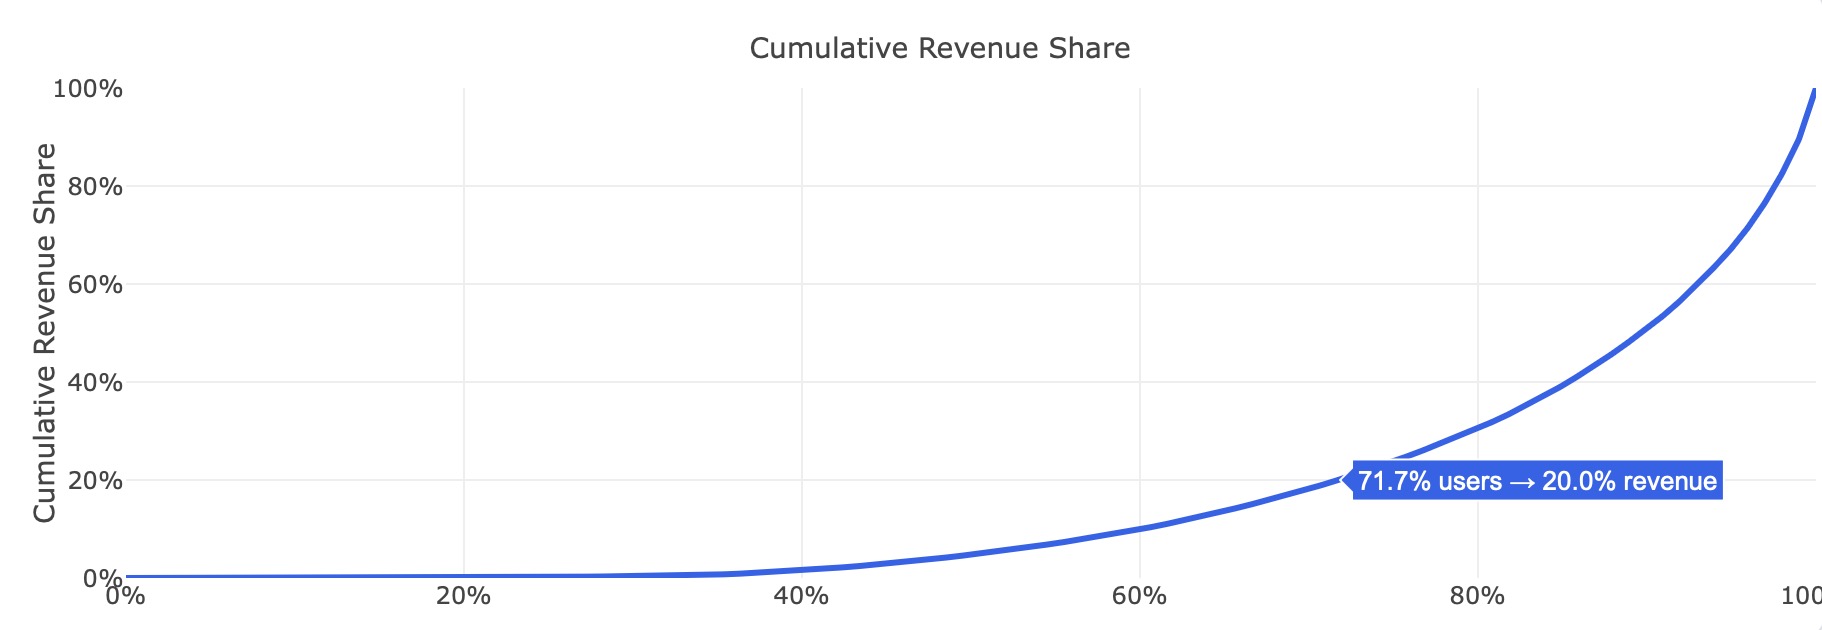
How much are whales affecting the numbers?
Clear recommendation: keep scaling or stop the test.
import os
import requests
token = os.environ["COHORTFUL_API_TOKEN"]
with open("cohorts.csv", "rb") as f:
resp = requests.post(
"https://app.cohortful.com/api/v1/datasets",
headers={"Authorization": f"Bearer {token}"},
files={"file": ("cohorts.csv", f, "text/csv")},
data={
"name": "my-dataset",
"aggregated": "false",
"features[]": "cohort",
"arpu_name": "arpu",
"profile_id": "1",
},
)
resp.raise_for_status()
print(resp.json())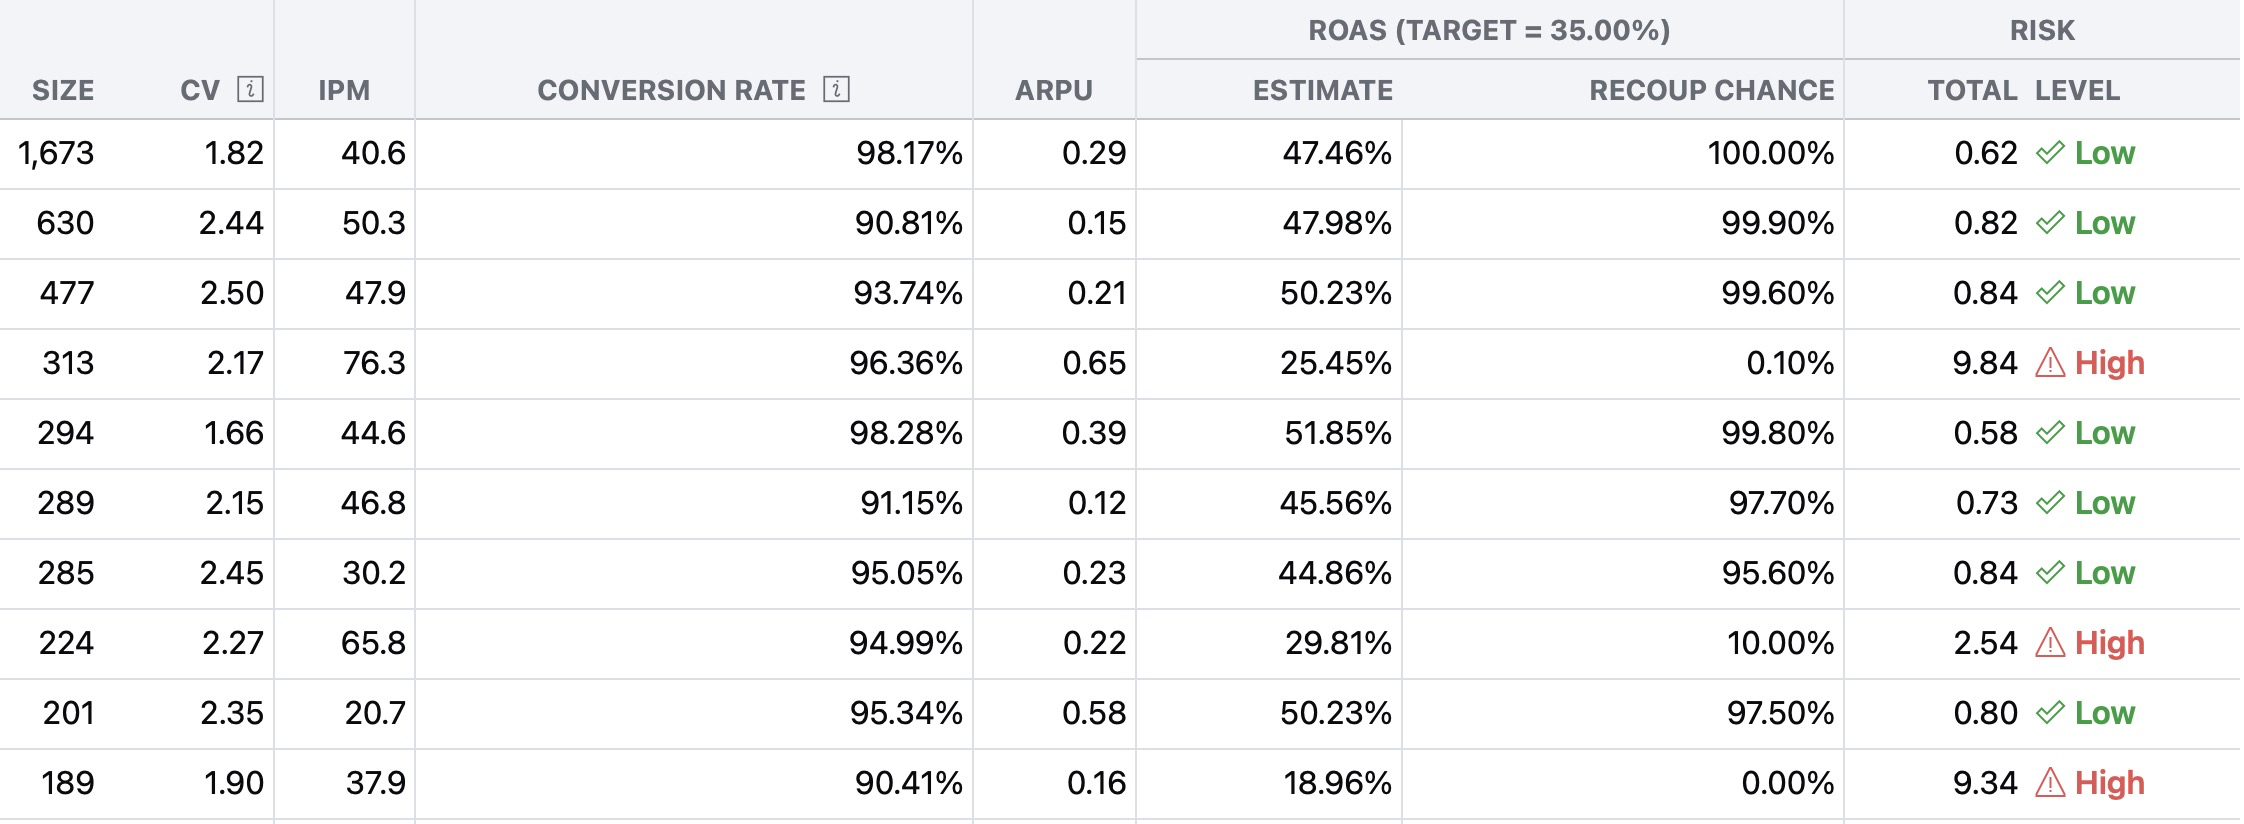
One whale can make a bad cohort look good — and that’s exactly what happens all the time.
Raw numbers lie on small cohorts. A single big spender can completely distort ROAS, IPM and payback probability.
Tomorrow he may not come, and the whole picture collapses.
That’s why simply looking at the numbers doesn’t work.
Cohortful does something different. We normalize the data so you see the real picture, not the distorted one.
We combine two things:
Sophisticated revenue modelling — we carefully align every revenue source.
Revenue variability analysis — we measure exactly how much whales are distorting the picture and how spread out the real revenue is inside the cohort.
This combination is what makes our signals reliable from D0.
Hey there!
Thanks for joining Cohortful early.
We help you catch weak cohorts faster, avoid wasted UA spend, and focus on what actually scales — separating real signal from whales and noise.
Can’t wait to walk you through a demo.
See you soon!